
딥러닝 MNIST 실습_캐글 Sign Language 데이터셋(2)_CNN을 이용한 풀이
1. 딥러닝의 개념
· 영어 알파벳 수화 데이터셋
(※ 링크 : https://www.kaggle.com/datamunge/sign-language-mnist)
1) 데이터셋 다운로드
import os
os.environ['KAGGLE_USERNAME'] = '<username>' # username
os.environ['KAGGLE_KEY'] = '<key>' # key
!kaggle datasets download -d datamunge/sign-language-mnist
!unzip sign-language-mnist.zip
2) 패키지 로드
from tensorflow.keras.models import Model
from tensorflow.keras.layers import Input, Dense, Conv2D, MaxPooling2D, Flatten, Dropout
from tensorflow.keras.optimizers import Adam, SGD
from tensorflow.keras.preprocessing.image import ImageDataGenerator
import numpy as np
import pandas as pd
import matplotlib.pyplot as plt
import seaborn as sns
from sklearn.model_selection import train_test_split
from sklearn.preprocessing import StandardScaler
from sklearn.preprocessing import OneHotEncoder
3) 데이터셋 로드
# 1) 트레이닝셋
train_df = pd.read_csv('sign_mnist_train.csv')

train_df.head()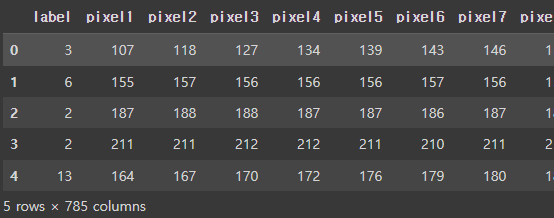
# 2) 테스트셋
test_df = pd.read_csv('sign_mnist_test.csv')

test_df.head()
4) 라벨 분포
9=J or 25=Z 는 동작이 들어가므로 제외, 총 24개의 라벨
plt.figure(figsize=(16, 10))
sns.countplot(train_df['label'])
plt.show()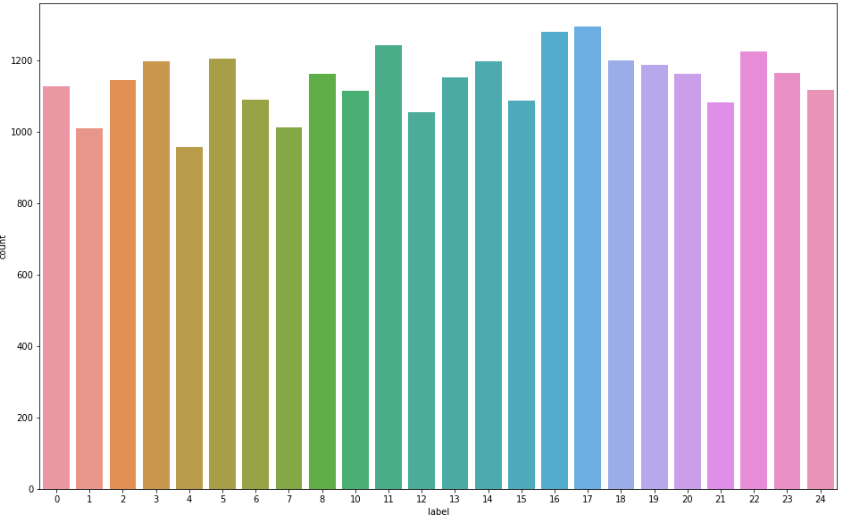
5) 전처리
입력과 출력 나누기
train_df = train_df.astype(np.float32)
x_train = train_df.drop(columns=['label'], axis=1).values
x_train = x_train.reshape((-1, 28, 28, 1))     # convolution 연산을 위해 3차원 데이터로 만들어 줌 (데이터셋 크기, 이미지 크기(가로, 세로), 그레이스케일->1 )
y_train = train_df[['label']].values

test_df = test_df.astype(np.float32)
x_test = test_df.drop(columns=['label'], axis=1).values
x_test = x_test.reshape((-1, 28, 28, 1))
y_test = test_df[['label']].values

print(x_train.shape, y_train.shape)
print(x_test.shape, y_test.shape)

"""
(27455, 28, 28, 1) (27455, 1)
(7172, 28, 28, 1) (7172, 1)
"""
6) 데이터 미리보기
index = 1
plt.title(str(y_train[index]))
plt.imshow(x_train[index].reshape((28, 28)), cmap='gray')       # 픽셀이 일자로 늘어서 있기 때문에 reshape를 해준다.
plt.show()          # onehot encoding 전 -> [6.], 후 -> [0. 0. 0. 0. 0. 0. 1. 0. ....]

7) One-hot encoding
encoder = OneHotEncoder()
y_train = encoder.fit_transform(y_train).toarray()
y_test = encoder.fit_transform(y_test).toarray()

print(y_train.shape)

"""
(27455, 24)
"""
8) 일반화
· 이미지 데이터는 픽셀이 0-255 사이의 정수(unsigned integer 8bit = uint8)로 되어있으므로, 255로 나누어 0-1 사이의 소수점 데이터(floating point 32bit = float32)로 일반화한다. 이때 ImageDataGenerator()를 사용한다.
train_image_datagen = ImageDataGenerator(
  rescale=1./255, # 일반화
)

train_datagen = train_image_datagen.flow(
    x=x_train,
    y=y_train,
    batch_size=256,
    shuffle=True        # 전체 데이터(27455개)를 섞어주어 랜덤성을 준다
)

test_image_datagen = ImageDataGenerator(
  rescale=1./255
)

test_datagen = test_image_datagen.flow(
    x=x_test,
    y=y_test,
    batch_size=256,
    shuffle=False     # 테스트 데이터에서는 랜덤성을 주지 않는다.
)

index = 1

preview_img = train_datagen.__getitem__(0)[0][index]
preview_label = train_datagen.__getitem__(0)[1][index]

plt.imshow(preview_img.reshape((28, 28)))
plt.title(str(preview_label))
plt.show()
9) 네트워크 구성
input = Input(shape=(28, 28, 1))

hidden = Conv2D(filters=32, kernel_size=3, strides=1, padding='same', activation='relu')(input)     # padding='same' input과 output을 동일하게 해준다.
hidden = MaxPooling2D(pool_size=2, strides=2)(hidden)       # conv2D에서는 좌측과 같이 pooling 단계를 거치면서 차원을 반으로 줄여준다.

hidden = Conv2D(filters=64, kernel_size=3, strides=1, padding='same', activation='relu')(hidden)
hidden = MaxPooling2D(pool_size=2, strides=2)(hidden)

hidden = Conv2D(filters=32, kernel_size=3, strides=1, padding='same', activation='relu')(hidden)
hidden = MaxPooling2D(pool_size=2, strides=2)(hidden)

hidden = Flatten()(hidden)

hidden = Dense(512, activation='relu')(hidden)        # 512개의 노드

hidden = Dropout(rate=0.3)(hidden)          # 오버피팅 방지. Dropout(rate=0.3) 30%의 노드를 랜덤으로 탈락시킨다.

output = Dense(24, activation='softmax')(hidden)

model = Model(inputs=input, outputs=output)

model.compile(loss='categorical_crossentropy', optimizer=Adam(lr=0.001), metrics=['acc'])

model.summary()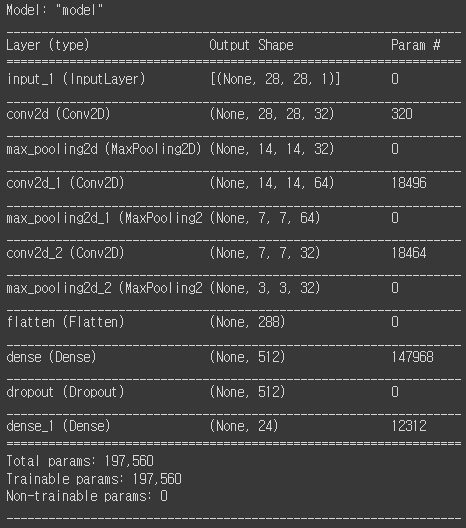
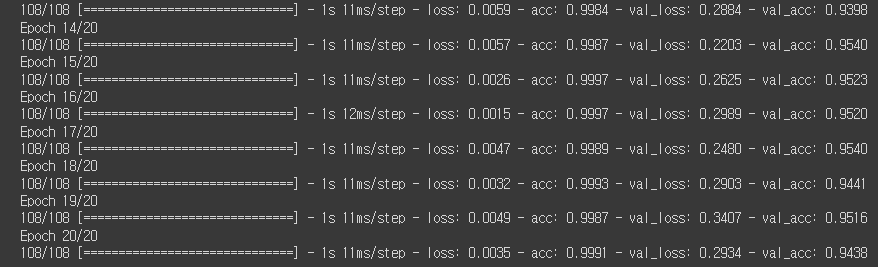
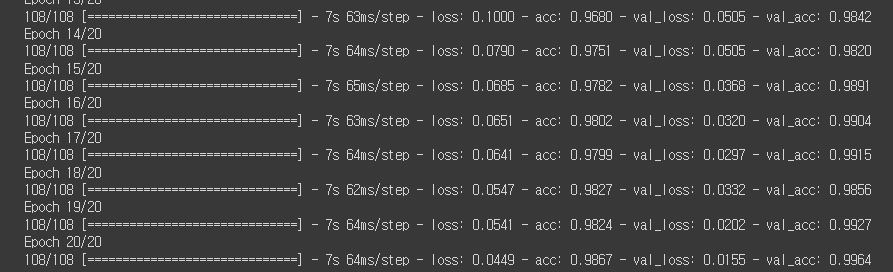
10) 학습
history = model.fit(
    train_datagen,
    validation_data=test_datagen, # 검증 데이터를 넣어주면 한 epoch이 끝날때마다 자동으로 검증
    epochs=20 # epochs 복수형으로 쓰기!
)
11) 학습 결과 그래프
fig, axes = plt.subplots(1, 2, figsize=(20, 6))
axes[0].plot(history.history['loss'])
axes[0].plot(history.history['val_loss'])
axes[1].plot(history.history['acc'])
axes[1].plot(history.history['val_acc'])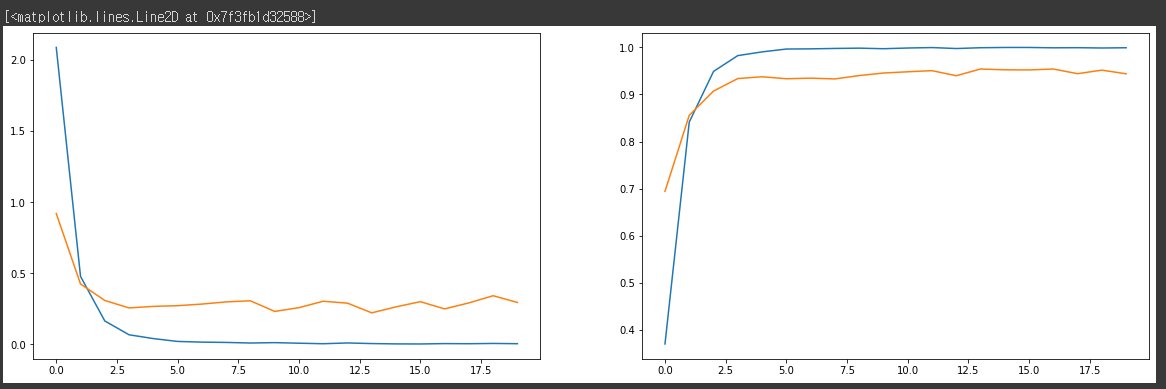
12) 이미지 증강기법
train_image_datagen = ImageDataGenerator(
  rescale=1./255, # 일반화
  rotation_range=10,  # 랜덤하게 이미지를 회전 (단위: 도, 0-180)
  zoom_range=0.1, # 랜덤하게 이미지 확대 (%)
  width_shift_range=0.1,  # 랜덤하게 이미지를 수평으로 이동 (%)
  height_shift_range=0.1,  # 랜덤하게 이미지를 수직으로 이동 (%)
)

train_datagen = train_image_datagen.flow(
    x=x_train,
    y=y_train,
    batch_size=256,
    shuffle=True
)

test_image_datagen = ImageDataGenerator(
  rescale=1./255
)

test_datagen = test_image_datagen.flow(
    x=x_test,
    y=y_test,
    batch_size=256,
    shuffle=False
)

index = 1

preview_img = train_datagen.__getitem__(0)[0][index]
preview_label = train_datagen.__getitem__(0)[1][index]

plt.imshow(preview_img.reshape((28, 28)))
plt.title(str(preview_label))
plt.show()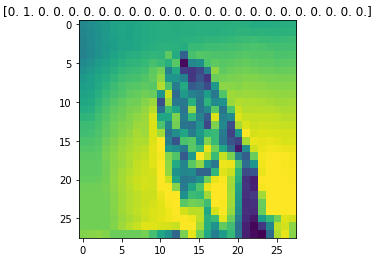
input = Input(shape=(28, 28, 1))

hidden = Conv2D(filters=32, kernel_size=3, strides=1, padding='same', activation='relu')(input)
hidden = MaxPooling2D(pool_size=2, strides=2)(hidden)

hidden = Conv2D(filters=64, kernel_size=3, strides=1, padding='same', activation='relu')(hidden)
hidden = MaxPooling2D(pool_size=2, strides=2)(hidden)

hidden = Conv2D(filters=32, kernel_size=3, strides=1, padding='same', activation='relu')(hidden)
hidden = MaxPooling2D(pool_size=2, strides=2)(hidden)

hidden = Flatten()(hidden)

hidden = Dense(512, activation='relu')(hidden)

hidden = Dropout(rate=0.3)(hidden)

output = Dense(24, activation='softmax')(hidden)

model = Model(inputs=input, outputs=output)

model.compile(loss='categorical_crossentropy', optimizer=Adam(lr=0.001), metrics=['acc'])

model.summary()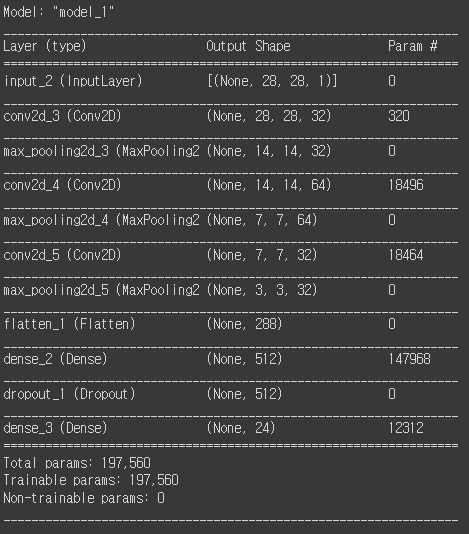
history = model.fit(
    train_datagen,
    validation_data=test_datagen, # 검증 데이터를 넣어주면 한 epoch이 끝날때마다 자동으로 검증
    epochs=20 # epochs 복수형으로 쓰기!
)
fig, axes = plt.subplots(1, 2, figsize=(20, 6))
axes[0].plot(history.history['loss'])
axes[0].plot(history.history['val_loss'])
axes[1].plot(history.history['acc'])
axes[1].plot(history.history['val_acc'])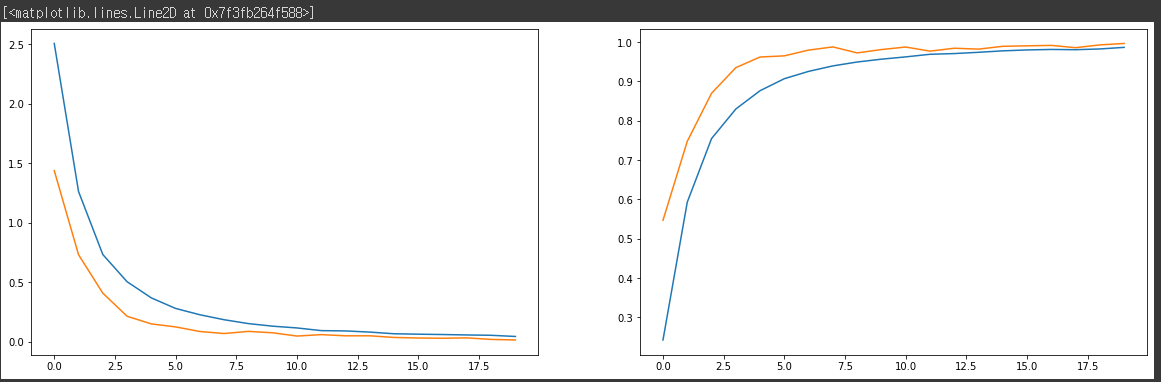
반응형
'DataScience > 머신러닝' 카테고리의 다른 글
| 파이썬 웹 프로그래밍 :: 10월 셋째주 WIL #07 (0) | 2022.10.20 |
|---|---|
| 머신러닝 :: 딥러닝 MNIST 실습_과일 종류 예측 (0) | 2022.10.14 |
| 머신러닝 :: 딥러닝_전이학습, 순환신경망(RNN), 생성적 적대 신경망(GAN) (0) | 2022.10.13 |
| 머신러닝 :: 합성곱 신경망(CNN, Convolutional Neural Networks) (0) | 2022.10.13 |
| 머신러닝 :: 딥러닝 MNIST 실습_캐글 Sign Language 데이터셋 (0) | 2022.10.13 |


댓글